An ambitious project
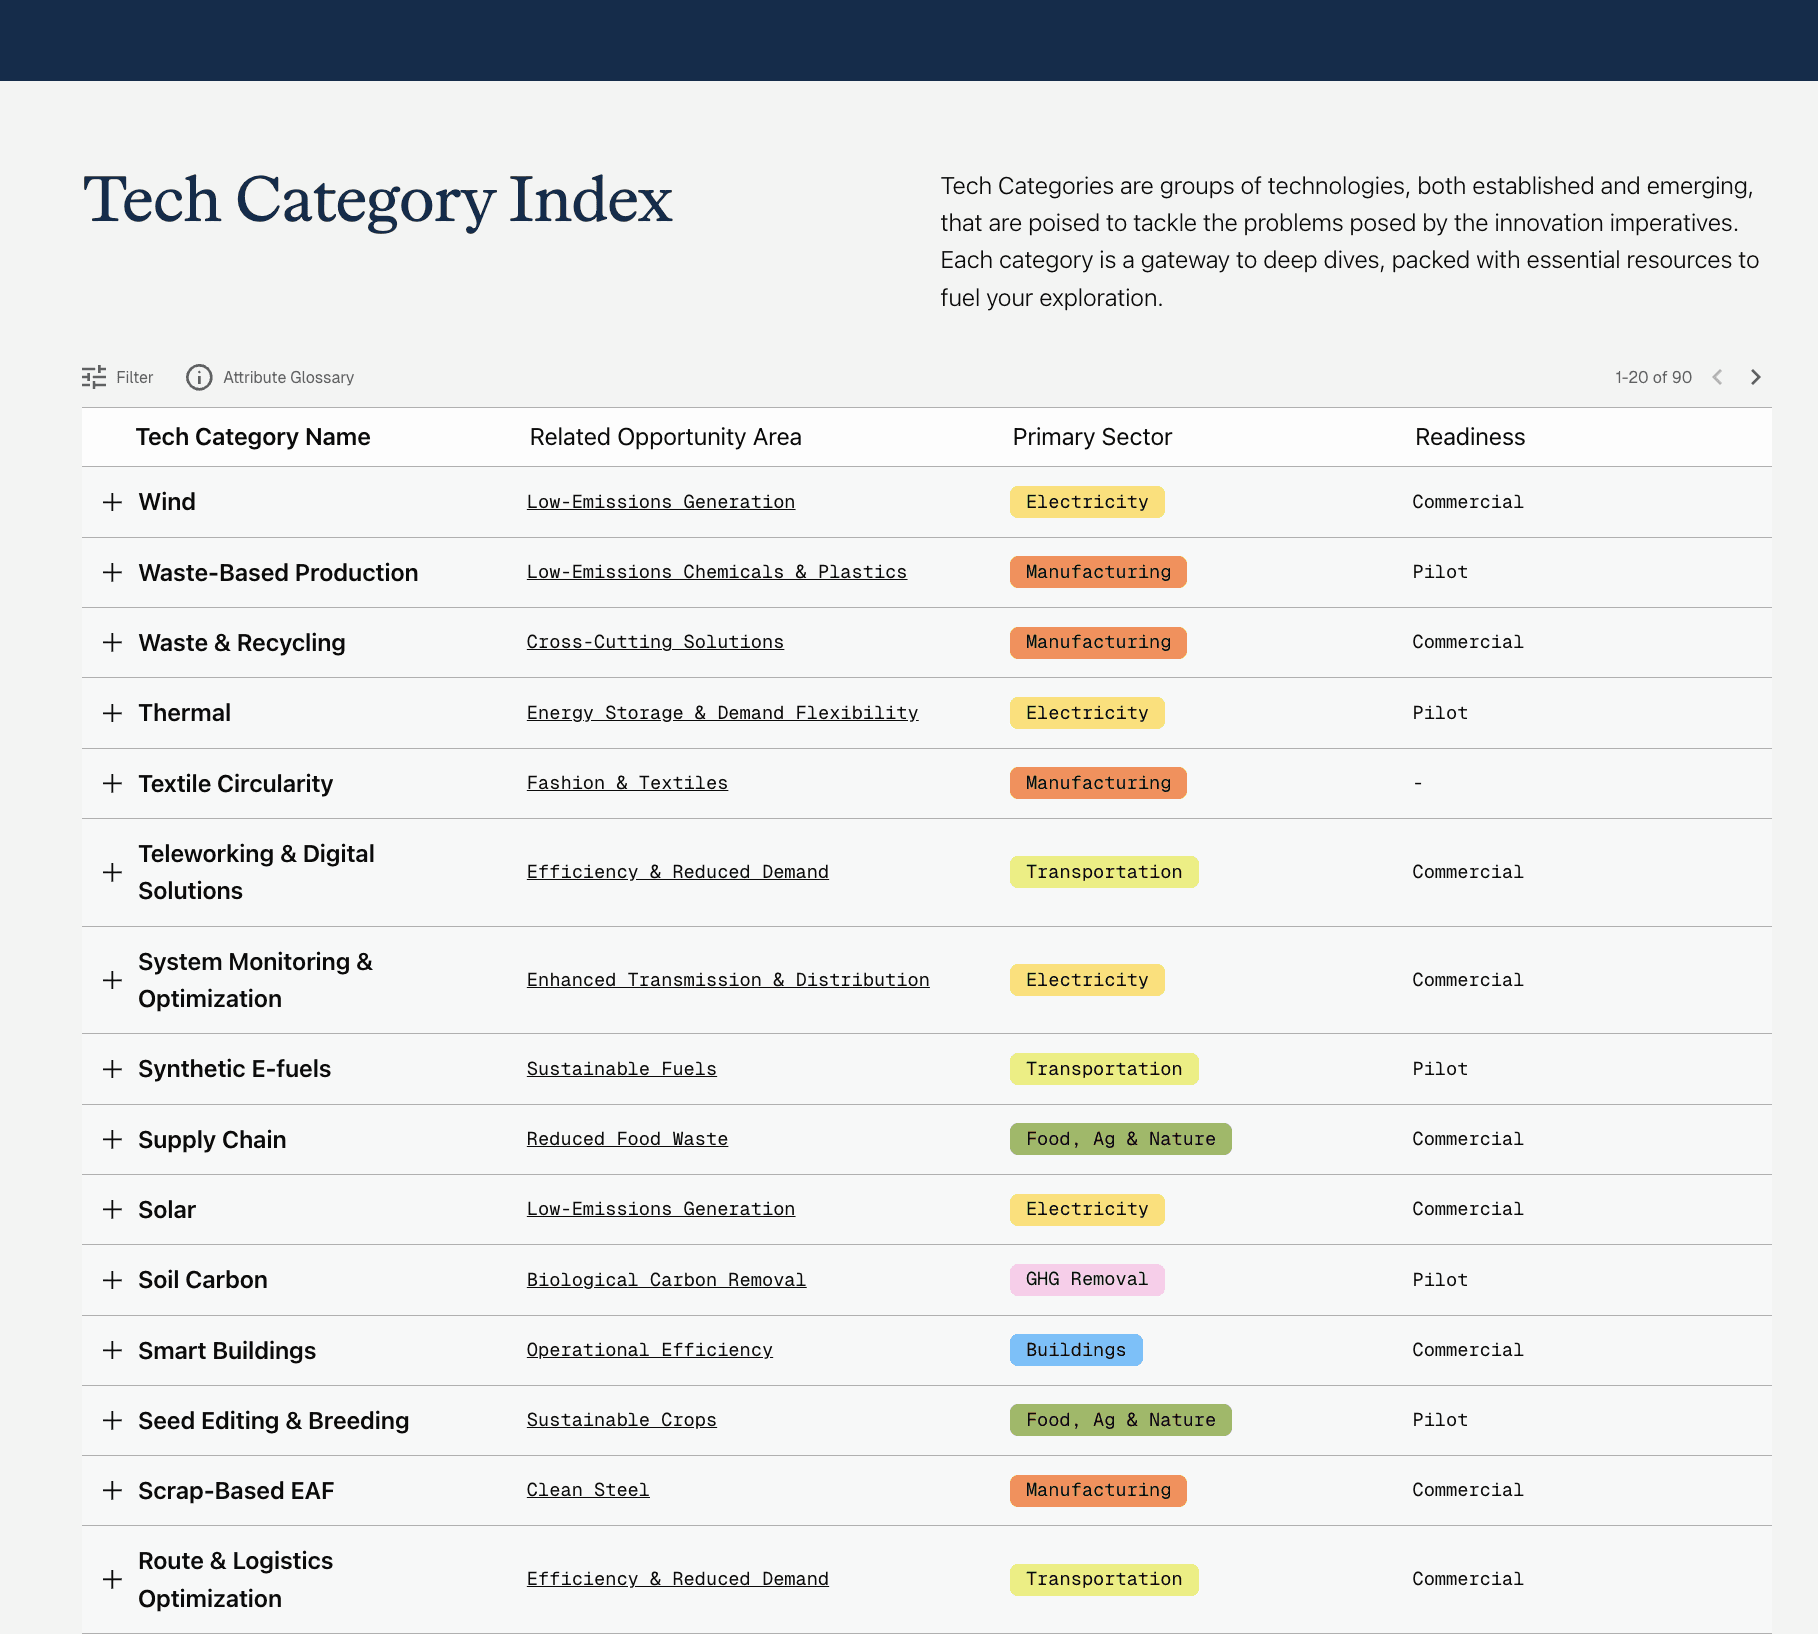
The Climate Tech Map charts the innovation imperatives and moonshots that can accelerate the path to net zero. From near-term breakthroughs to high-risk, high-reward technologies, we invite students, innovators, investors, policymakers, philanthropists, and the inherently curious to envision and build a decarbonized future.
Led by Speed&Scale, Elemental was part of a coalition of climate organizations that led this project. The brand identity, UX, and web development was led by Pentagram.




I loved being on the team making the Climate Tech Atlas—it's a huge win and opportunity for design to really support climate impact.
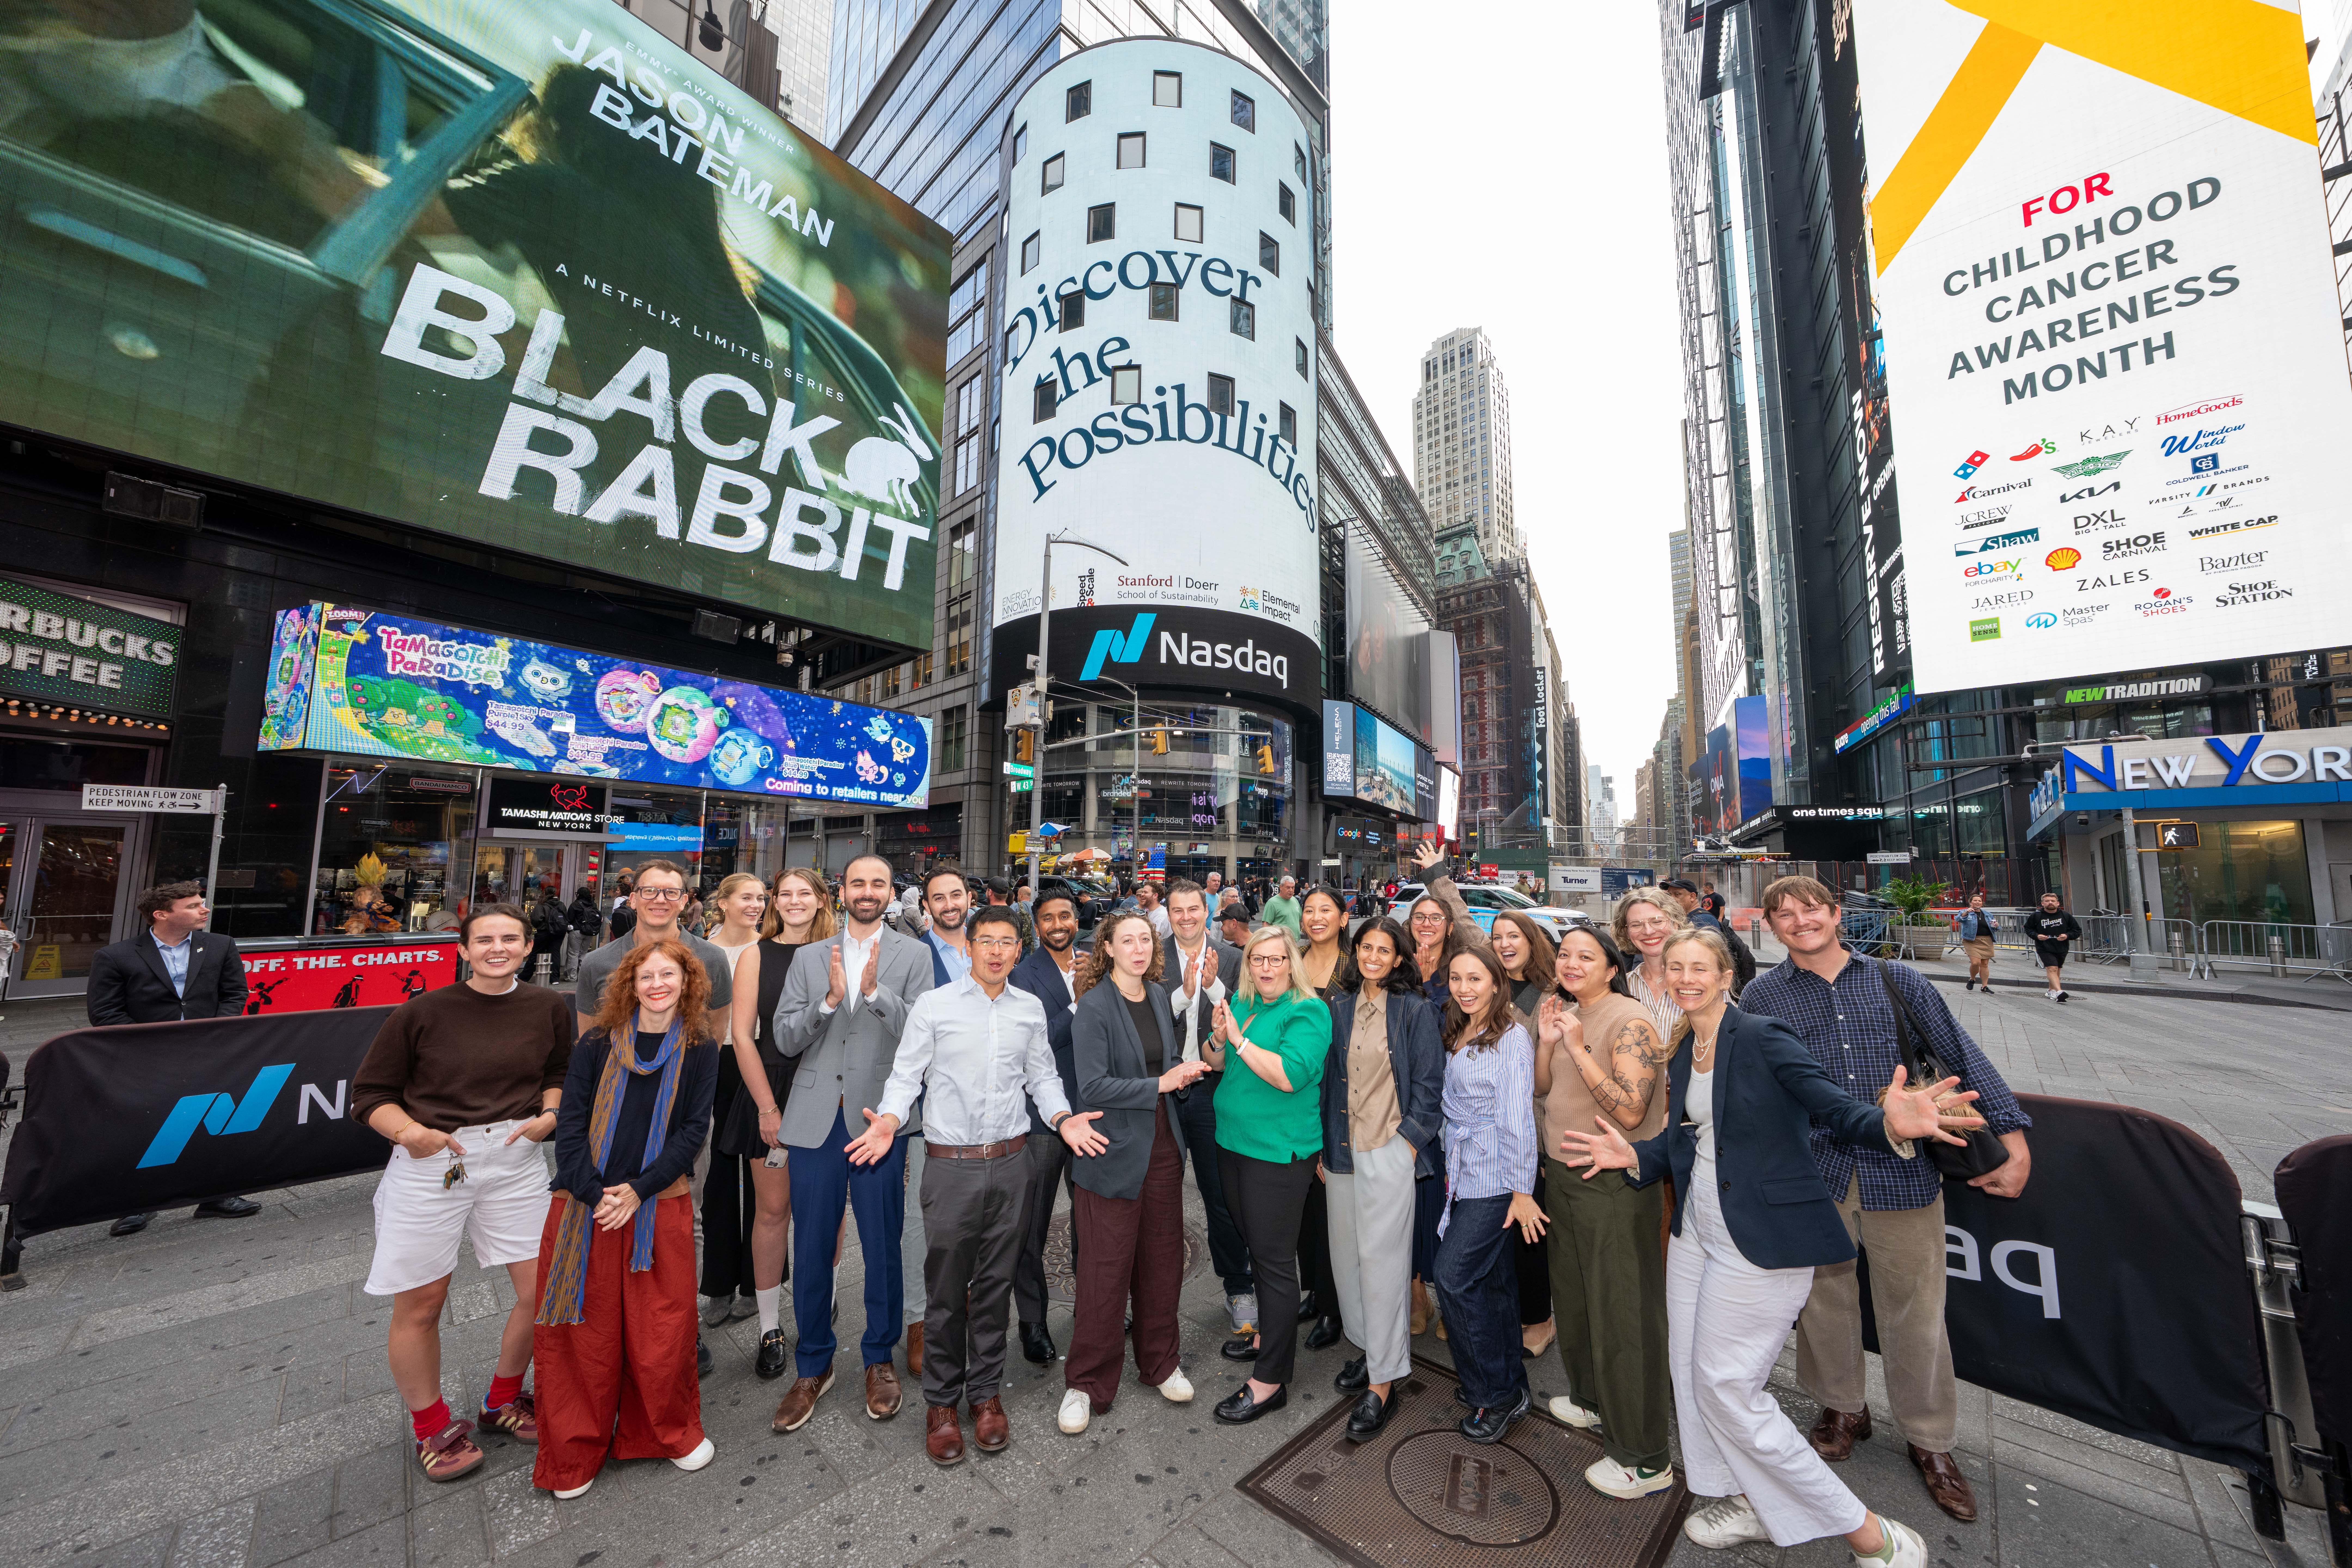
From drafting the original request for proposals, to the launch at New York Climate Week, I was honored to provide design guidance, feedback, and inspiration. As the only designer on the coalition side, I viewed my role as a bridge between the climate tech side, and the design team.
One of my favorite ways that I guided the development of the Climate Tech Map was in advocating for its circle with spokes structure as the main scaffolding for information. The radians around the center show a complete, 360 degrees of climate solutions. There is a sense of completeness, that makes the content feel whole and considered, and not just an endless list. It is universe of climate solutions, not just any diagram or . Design is what makes the atlas approachable, creating a visually appealing and intuitive experience that invites users to enjoy the process, to explore, connect the dots, and uncover insights along the way.